Accuracy Overview

The goal of this paper is to present the quality of Placense products, by providing accurate measurements of the footfall levels, trends, and seasonality results generated by our data and algorithms, with respect to external ground truth resources.
Placense develops advanced location intelligence technologies, for providing meaningful and actionable insights. It is our mission to empower businesses to understand and forecast people’s movement and behavior and provide additional information regarding their client's demographics. We enable consumer-centric decision-making based on data from millions of people while following strict privacy guidelines. To ensure compliance with GDPR and further privacy laws, Placense only provides aggregated, anonymized location insights to clients.
Anonymized datasets do not allow for any identification of individuals even when combined with additional datasets by third parties. This level of privacy protection is achieved by combining several techniques in the process, such as aggregation and generalization.
Technology
As an advanced technology company, Placense greatly invests in continuous research and development of its platform, harnessing machine learning and big data technologies to generate valuable intelligence for our customers. Furthermore, we apply advanced discovery and visualization schemes, for showing insights and trends from multiple angles and depths.
A major piece of Placense’s technology is the system’s mass database, which is primarily comprised of user visitation records obtained from mobile apps via GPS signaling. Our raw visitation data originates from various sources, enforcing strong criteria over the records transmitted to our system, for validating their quality and privacy characteristics.
Once the raw data reaches our premises, we apply a proprietary process for normalizing, cleansing, aggregating, and enriching the data. In this process, we crunch large amounts of data while ensuring a high level of quality.
Algorithms & Methods
One of the GPS’s main advantages is its geographical precision, which can reach the level of centimeters, as opposed to other positioning technologies (e.g. cellular triangulation). Such accuracy enables the production of intelligence and insights in a granularity level that has never been seen before in the offline world. Yet, GPS technology has its challenges in aggregating multiple signals seen in a given location at a given time, into an accurate quantity of visitors or visits. This is mainly due to inconsistency in the representation level of the data over different locations at different times, which can occur due to multiple reasons, some being: different mobile app usage patterns across different population groups; different mobile app usage patterns across different activities (e.g. dining vs shopping); and different property structures, which can strongly affect the quality and quantity of the signals.
In order to project realistic footfall metrics for a given location, Placense has developed a patent pending proprietary machine learning-based algorithm, over the visitors and visits occurring in the location within our data. In essence, we seek the desired coefficients based on the location’s geographical placement, its functional purpose/s, and additional features related to the location, its visitors, and its surroundings.
Our feature set is one of the keystones in our technology and was developed based on in-depth knowledge of the business domain, combined with data science expertise.
Our machine learning topology consists of multiple instances of mathematical models, where each instance can be of different methods and different settings. The models are continuously trained and tested in various regions/locations, and weighted according to their performance.
Data Panel
At this stage, Placense provides services in Germany and Netherlands to various customers of both the public and the private sectors. To continue doing so successfully and consistently, Placense products rely on a large data panel of over 8 million unique devices in Germany and over 2 million unique devices in the Netherlands on average each month. These devices generate above 2 billion monthly pings on average via which a well-informed representation of reality is constructed via the various company products. To date, the aforementioned data combine to a data warehouse that weighs over 50 terabytes.
Evaluation Methodology
Using the processes described in the previous chapters, we at Placense aim to provide insights of the highest reliability. To evaluate our methods, in this paper we perform various analyses of different locations and measure the accuracy of our results against the ground truth figures.
The accuracy is calculated in the following way:

in such case, the accuracy would result in 90%. The result would remain the same if E(y) and Y would be 10 and 9 respectively.
Evaluation Results
The products and services Placense offers, primarily rely on the ability to estimate footfall levels, footfall trends, and footfall seasonality. Therefore, the evaluation will focus on these core components.
Footfall Trend
Among its services, Placense helps clients to understand how their campaigns, external design, or physical surroundings changes, influence the footfall in their business, and how their footfall trends compare to their competitors. To do so, the accuracy of the trend itself should be assessed. For this evaluation, our data was compared to real-world countings of 110 pedestrian high streets across Germany, collected by a third-party company that placed laser counters in all of the entrances of these streets - see the following example of such highstreet, showing its polygon bounding in figure 1.

Figure 1 - Highstreet polygon
Figures 2 and 3 show the comparison of the aggregated ground truth trends vs the trends as measured by our system - in weekly and monthly aggregation.
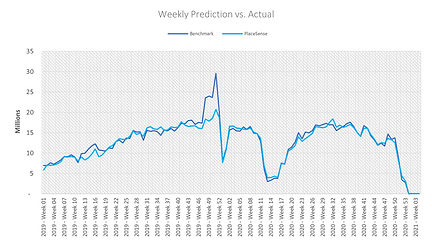
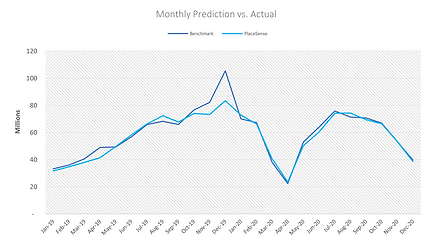
Figure 2 - Monthly aggregation
Figure 3 - Weekly aggregation
The average accuracy of Placense output is 90% when the aggregation is made on a monthly level and 87.5% when aggregation is done on a weekly level.
Below are presented several examples of visualizations for separate locations with ground truth comparison.
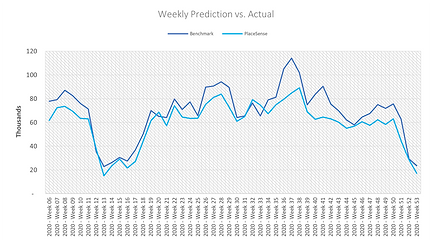
Figure 4 - Single location comparison
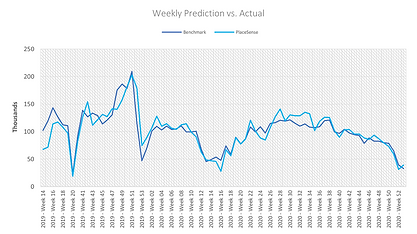
Figure 5 - Single location comparison
Footfall seasonality
Placense provides its clients with seasonality data via which the clients can adapt their manpower staffing and compare the way their trend differs from that of their physical surrounding area and from their competitors. For the purpose of evaluating this product, our data was benchmarked vs the hourly level data of the same 110 locations that were used for the weekly and monthly trends.
While the source of the data in this measurement is the same as in the footfall trends, testing against the same source for different granularity and aggregational levels is important. While results may seem good on a weekly or monthly level, it is possible that the aggregated data of hourly levels might deviate substantially from the ground truth as 2 sided errors of different times of day might cancel each other out when combined together.
Figure 7 shows a comparison to an aggregate of all 110 locations with an accuracy of 84%.
Figure 8 shows a comparison to a single location.

Figure 6 - Seasonality of all 110 locations avg.
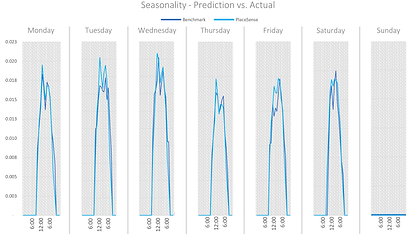
Figure 7 - Seasonality of a single location
Footfall levels
While Placense provides much value in the relative sphere, it also provides the estimation of the real population that the sample represents. Placense’s footfall estimation technology enables our customers to accurately assess foot traffic within buildings or in their proximity. To do so, the research employed real-world ground truth data that was split for training and validation purposes. The data that is evaluated in this section were generated by a third part company that supplied yearly aggregations of total visitors for 70 shopping centers across Germany.
It is worth noting that while our model relies on a wide range of features, in order to produce the best results, a client who would like to receive absolute footfall levels is expected to provide real footfall counts for a sample set of related locations. These figures will then serve as training data for the purpose of model calibration.
Conclusion
Figure 8 shows our model estimates versus the actual figures on a yearly aggregation level as were measured throughout multiple shopping centers across Germany.
The average accuracy of the real population
estimation as was achieved by our model is 87%.
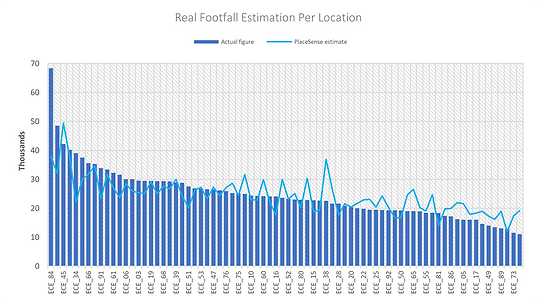
Figure 8 - Real Footfall estimation per location
Placense provides meaningful and actionable insights, which can lead to mission critical decisions - some of which were discussed in this paper. As a data company, Placense strives to continuously benchmark itself against ground truth data obtained from different sources.
In this paper, we’ve shown three such benchmarks - footfall levels, trends and seasonality. As mentioned above, these constitute the foundation for other numerous insights and analyses. This evaluation resulted in an accuracy rate of above 85% for all of the presented trend and seasonality figures, and with an accuracy of 80% for the estimated real footfall levels.
For any additional details or questions, we encourage you to contact our team, which will provide you with any type of guidance you might need.